Analyze
How to use the Dashboards.
Overall Energy Consumption Dashboard
This dashboard can be reached through this URL
(adjust the collector VM's IP address) using
default credentials admin/admin:
http://127.0.0.1:3000/d/energy-consumption-overview-dashboard
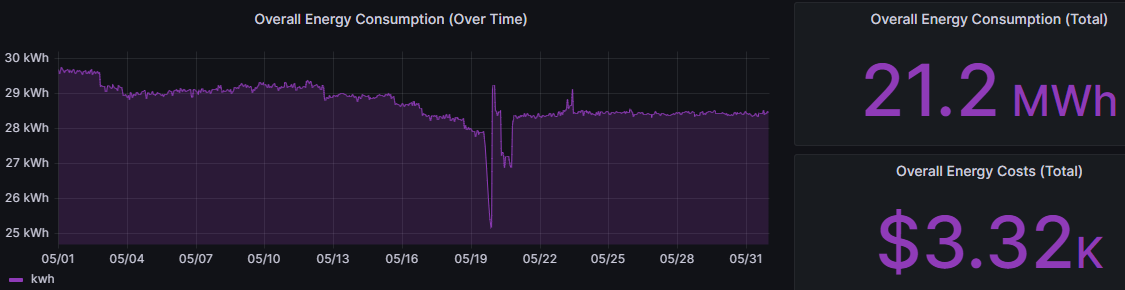
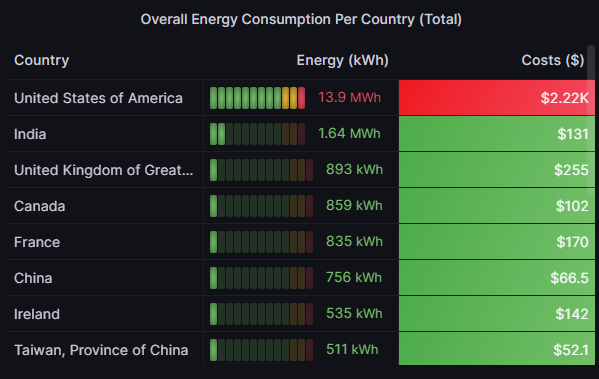
This provides an overview of all energy consumed in your Extreme network. Next to the overall stats, there are multiple rows that you can unfold that break down that overall number by switch, site and country. You can also filter this dashboard's data by site and country using the drop-downs at the top-left of the dashboard. Here is another screenshot that shows the energy consumption and costs per country:
PoE Dashboard
This dashboard can be reached through this URL
(adjust the collector VM's IP address) using
default credentials admin/admin:
http://127.0.0.1:3000/d/http://10.139.33.239:3000/d/poe-consumption-dashboard/
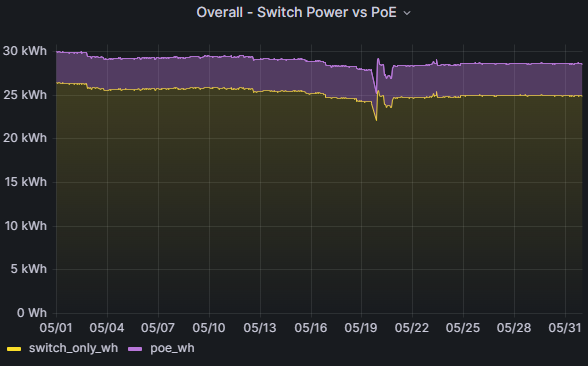
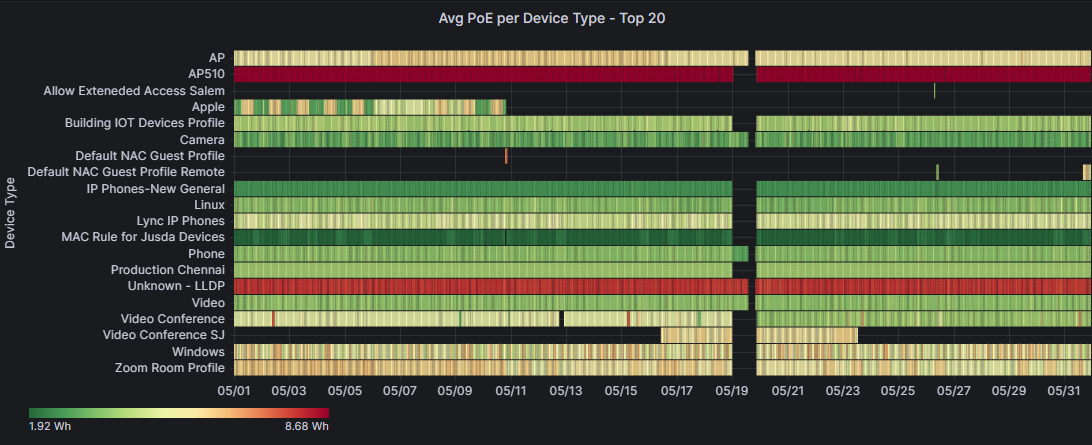
This provides a more detailed view on the energy consumed by any connected PoE device. Another screenshot that shows the average energy consumed per device type and hour:
Basic Dashboard
This dashboard can be reached through this URL
(adjust the collector VM's IP address):
http://127.0.0.1:3000/d/basicdashboard/basic
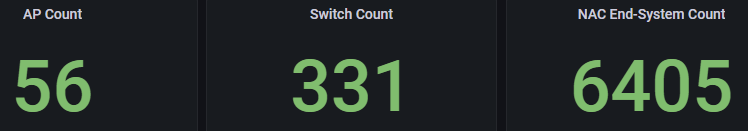
This provides an overview of your infrastructure that is actually being queried by the collect. This can be used to verify whether you receive data from those devices you expect. Below the top-level widgets, there are detailed lists of switches, APs and NAC end-systems. If you are missing any devices here it could be due to a config issue or the fact that the collector doesn't support all of Extreme's HW and SW versions.